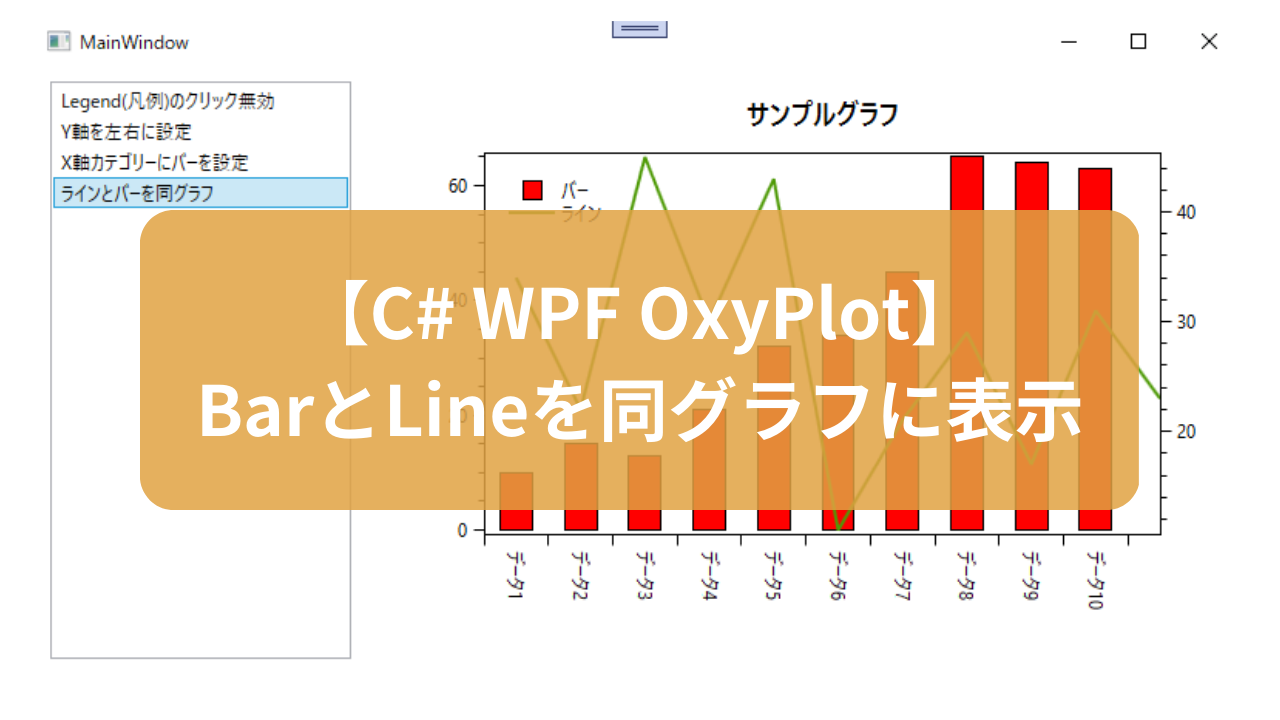
本記事では、C# WPFアプリケーション OxyPlot にて、BarとLineを同グラフに表示する方法について書きます。
開発環境
- Windows10
- Microsoft Visual Studio Community2022
- .NET 6
- WPF アプリ
- OxyPlot 2.1.2
目次
やりたいこと
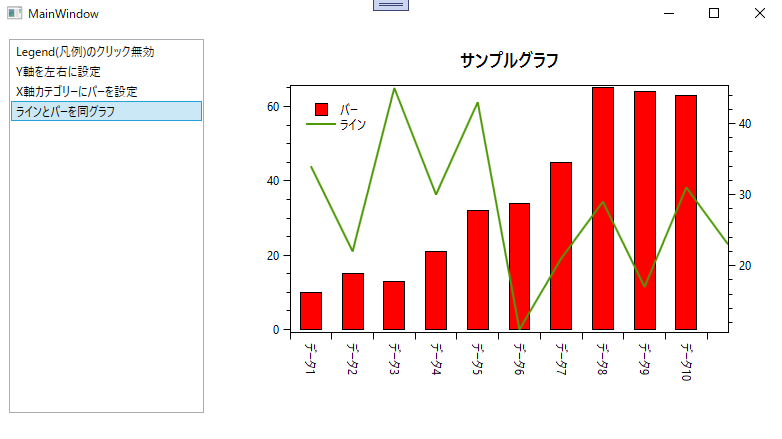
OxyPlot で、LineとBarを同グラフに表示します。X軸のカテゴリーは、BarとLine共通です。左側のY軸はBar、右側のY軸はLineに対応します。
コード
PlotModelを生成するコードです。
using OxyPlot;
using OxyPlot.Axes;
using OxyPlot.Legends;
using OxyPlot.Series;

namespace OxyPlotProject.OxyPlotPlotModel
{
    /// <summary>
    /// ラインとバーを同グラフPlotModelファクトリー
    /// </summary>
    internal class LineBarSamePlotModelFactory : AbstPlotModelFactory
    {
        public override PlotModel Create()
        {
            // モデル
            PlotModel plotModel = new PlotModel();
            plotModel.Title = "サンプルグラフ";

            // カテゴリーX軸
            CategoryAxis xAxis = new CategoryAxis();
            xAxis.Position = AxisPosition.Bottom;
            xAxis.Key = "xAxis";
            xAxis.Angle = 90;
            plotModel.Axes.Add(xAxis);

            // バーY軸
            LinearAxis yAxisBar = new LinearAxis();
            yAxisBar.Position = AxisPosition.Left;
            yAxisBar.Key = "yAxisBar";
            plotModel.Axes.Add(yAxisBar);

            // ラインY軸
            LinearAxis yAxisLine = new LinearAxis();
            yAxisLine.Position = AxisPosition.Right;
            yAxisLine.Key = "yAxisLine";
            plotModel.Axes.Add(yAxisLine);

            // カテゴリーX軸の値
            xAxis.Labels.Add("データ1");
            xAxis.Labels.Add("データ2");
            xAxis.Labels.Add("データ3");
            xAxis.Labels.Add("データ4");
            xAxis.Labels.Add("データ5");
            xAxis.Labels.Add("データ6");
            xAxis.Labels.Add("データ7");
            xAxis.Labels.Add("データ8");
            xAxis.Labels.Add("データ9");
            xAxis.Labels.Add("データ10");

            // バー
            BarSeries barSeries = new BarSeries();
            barSeries.Title = "バー";
            barSeries.XAxisKey = "yAxisBar";
            barSeries.YAxisKey = "xAxis";
            barSeries.FillColor = OxyColors.Red;
            barSeries.StrokeThickness = 1;
            barSeries.StrokeColor = OxyColors.Black;
            barSeries.BarWidth = 50;

            barSeries.Items.Add(new BarItem() { Value = 10 });
            barSeries.Items.Add(new BarItem() { Value = 15 });
            barSeries.Items.Add(new BarItem() { Value = 13 });
            barSeries.Items.Add(new BarItem() { Value = 21 });
            barSeries.Items.Add(new BarItem() { Value = 32 });
            barSeries.Items.Add(new BarItem() { Value = 34 });
            barSeries.Items.Add(new BarItem() { Value = 45 });
            barSeries.Items.Add(new BarItem() { Value = 65 });
            barSeries.Items.Add(new BarItem() { Value = 64 });
            barSeries.Items.Add(new BarItem() { Value = 63 });
            plotModel.Series.Add(barSeries);

            // ライン
            // DataPointの第1引数は、X軸のインデックス値とする
            LineSeries lineSeries = new LineSeries();
            lineSeries.Title = "ライン";
            lineSeries.YAxisKey = "yAxisLine";
            lineSeries.Points.Add(new DataPoint(0, 34));
            lineSeries.Points.Add(new DataPoint(1, 22));
            lineSeries.Points.Add(new DataPoint(2, 45));
            lineSeries.Points.Add(new DataPoint(3, 30));
            lineSeries.Points.Add(new DataPoint(4, 43));
            lineSeries.Points.Add(new DataPoint(5, 11));
            lineSeries.Points.Add(new DataPoint(6, 21));
            lineSeries.Points.Add(new DataPoint(7, 29));
            lineSeries.Points.Add(new DataPoint(8, 17));
            lineSeries.Points.Add(new DataPoint(9, 31));
            plotModel.Series.Add(lineSeries);

            // 凡例
            Legend legend = new Legend();
            legend.LegendSymbolLength = 30;
            legend.LegendPosition = LegendPosition.TopLeft;
            plotModel.Legends.Add(legend);

            return plotModel;

        }
    }
}
ポイントは、
- xAxis.Labels でLineとBar共通の値を設定する
- barSeries.Items のインデックスとxAxis.Labels のインデックスは同じ
- lineSeries.Points に設定するDataPointの第1引数はxAxis.Labelsのインデックスと同じ
です。
プロジェクトを実行したところ、↓のようにBarとLineを同グラフに表示できました。
プロジェクトは↓からダウンロードできます。
GitHub

GitHub - HomeProgrammer81/OxyPlotProject at main_barLineSame
Contribute to HomeProgrammer81/OxyPlotProject development by creating an account on GitHub.
まとめ
C# WPFアプリケーション OxyPlot にて、BarとLineを同グラフに表示する方法について書きました。


コメント