
C# WPFアプリケーションにて、OxyPlotを使用して円グラフを描画する方法を書きます。
開発環境
- Windows10
- Microsoft Visual Studio Community2022
- .NET 6
- WPF アプリ
- OxyPlot 2.1.2
目次
やりたいこと
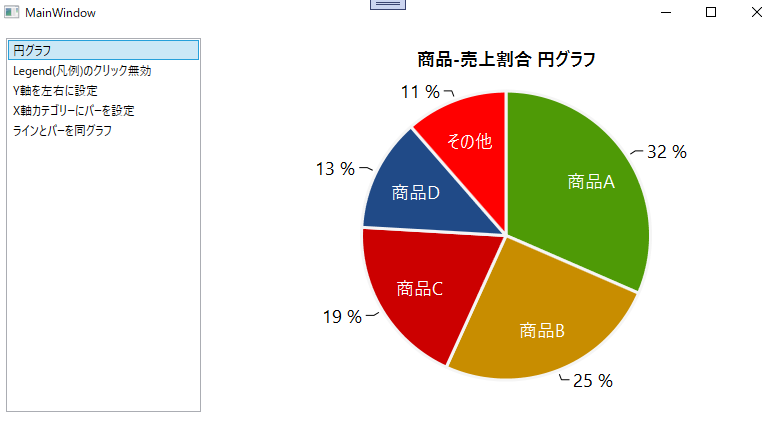
やりたいことは、OxyPlotを使用して、↓のような円グラフを描画することです。
コード
- 円グラフを表示するために、PieSeriesを使用します。
using OxyPlot;
using OxyPlot.Legends;
using OxyPlot.Series;
using System;
using System.Collections.Generic;

namespace OxyPlotProject.OxyPlotPlotModel
{
    /// <summary>
    /// 円グラフPlotModelファクトリー
    /// </summary>
    internal class PieSeriesPlotModelFactory : AbstPlotModelFactory
    {
        private List<Tuple<string, double>> pieDataList = new List<Tuple<string, double>>()
        {
            new Tuple<string, double>( "商品A", 25394),
            new Tuple<string, double>( "商品B", 20343),
            new Tuple<string, double>( "商品C", 15400),
            new Tuple<string, double>( "商品D", 10200),
            new Tuple<string, double>( "その他", 9200),
        };

        public override PlotModel Create()
        {
            // モデル
            PlotModel plotModel = new PlotModel();
            plotModel.Title = "商品-売上割合 円グラフ";
            plotModel.TitlePadding= 20;                     // タイトルのパディング

            // パイシリーズ
            PieSeries pieSeries = new PieSeries();

            pieSeries.InsideLabelColor = OxyColors.White;   // 内部ラベルの色
            pieSeries.InsideLabelPosition = 0.7;            // 内部ラベル位置

            pieSeries.FontSize = 18;                        // フォントサイズ

            pieSeries.Stroke = OxyColors.WhiteSmoke;        // ボーダーの色
            pieSeries.StrokeThickness = 3;                  // ボーダーの幅

            pieSeries.TickDistance = 4;                     // 円の端と、割合の線の距離

            pieSeries.StartAngle = -90;                     // データの開始角度

            // データ設定
            foreach( Tuple<string, double> tuple in pieDataList )
            {
                PieSlice pieSlice = new PieSlice(tuple.Item1, tuple.Item2);
                pieSeries.Slices.Add(pieSlice);
            }

            plotModel.Series.Add(pieSeries);

            return plotModel;
        }
    }
}
PieSeriesのStartAngleプロパティを-90にしました。デフォルト値は0で、時計回りが正方向のようです。円グラフの場合、12時の位置が開始が一般的に思います。
プロジェクトを実行したところ、↓のグラフを表示できました。
プロジェクトは↓からダウンロードできます。
GitHub

GitHub - HomeProgrammer81/OxyPlotProject at main_pie
Contribute to HomeProgrammer81/OxyPlotProject development by creating an account on GitHub.
まとめ
C# WPFアプリケーションにて、OxyPlotを使用して円グラフを描画する方法を書きました。


コメント