C# WPFアプリケーションにおいて、OxyPlotで棒グラフを描画する方法をお伝えします。
開発環境
- Windows10
- Microsoft Visual Studio Community2022
- .NET 6
- WPF アプリ
- OxyPlot 2.1.2
目次
やりたいこと
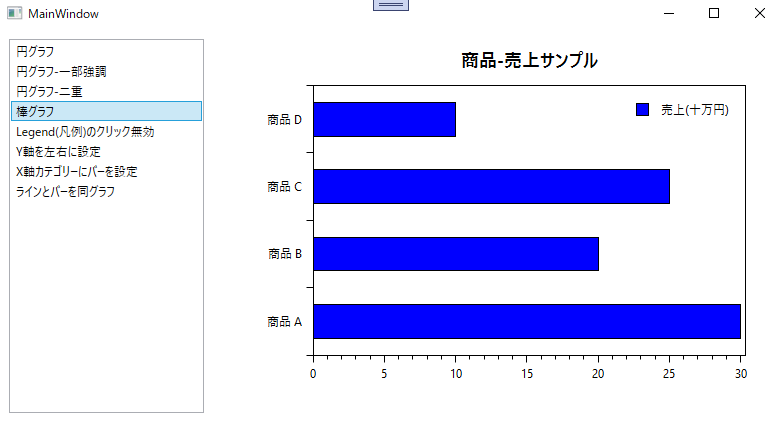
やりたいことは、OxyPlot で↓のような棒グラフを描画することです。
コード
- y軸は、CategoryAxisで設定します。
- 棒グラフは、BarSeriesを使用します。CategoryAxisのLabelsのインデックスと、BarSeriesのItems のインデックスが対応します。
using OxyPlot;
using OxyPlot.Axes;
using OxyPlot.Legends;
using OxyPlot.Series;
using System;
using System.Collections.Generic;
using System.Linq;
using System.Text;
using System.Threading.Tasks;

namespace OxyPlotProject.OxyPlotPlotModel
{
    /// <summary>
    /// 棒グラフプロットモデルファクトリー
    /// </summary>
    internal class BarPlotModelFactory : AbstPlotModelFactory
    {
        public override PlotModel Create()
        {
            // モデル
            PlotModel plotModel = new PlotModel();
            plotModel.Title = "商品-売上サンプル";

            // カテゴリー
            CategoryAxis axis = new CategoryAxis();
            axis.Position = AxisPosition.Left;
            axis.Labels.Add("商品 A");
            axis.Labels.Add("商品 B");
            axis.Labels.Add("商品 C");
            axis.Labels.Add("商品 D");
            plotModel.Axes.Add(axis);

            // バー
            BarSeries barSeries = new BarSeries();
            barSeries.Title = "売上(十万円)";
            barSeries.FillColor = OxyColors.Red;
            barSeries.StrokeThickness = 1;
            barSeries.StrokeColor = OxyColors.Black;
            barSeries.FillColor = OxyColors.Blue;
            barSeries.BarWidth = 50;
            barSeries.Items.Add(new BarItem() { Value = 30 });
            barSeries.Items.Add(new BarItem() { Value = 20 });
            barSeries.Items.Add(new BarItem() { Value = 25 });
            barSeries.Items.Add(new BarItem() { Value = 10 });
            plotModel.Series.Add(barSeries);

            // 凡例
            Legend legend = new Legend();
            legend.LegendSymbolLength = 30;
            legend.LegendPosition = LegendPosition.TopRight;
            plotModel.Legends.Add(legend);

            return plotModel;

        }
    }
}
プロジェクトを実行したところ↓の棒グラフを表示できました。
まとめ
C# WPFアプリケーションにおいて、OxyPlotで棒グラフを描画する方法をお伝えしました。


コメント