
本記事は、C# WPFアプリケーション OxyPlotにおいて、Y軸を左右に設定する方法を書きます。
開発環境
- Windows10
- Microsoft Visual Studio Community2022
- .NET 6
- WPF アプリ
- OxyPlot 2.1.2
目次
やりたいこと
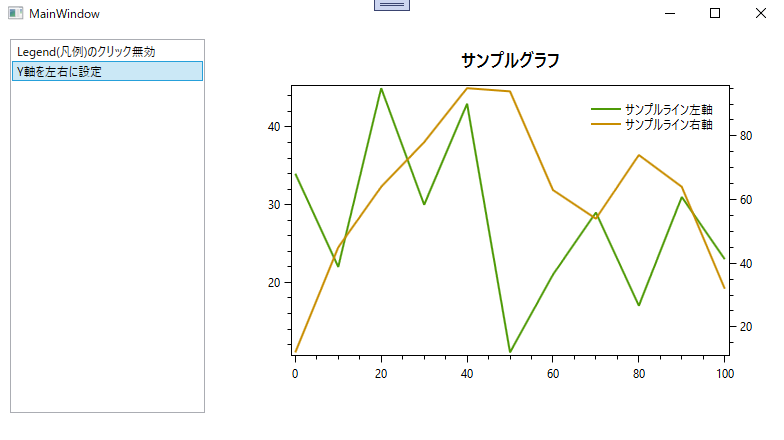
OxyPlotでY軸を左右両方に表示させます。緑は左側の軸に対応、黄は右側の軸に対応するようにします。
コード
ポイントは以下の通りです。
- 左側用、右側用のAxisを作成しキーを設定する。
- それぞれのラインに対し、対応したいAxis のキーを設定する
PlotModelを生成するコードは以下のようになります。
using OxyPlot;
using OxyPlot.Axes;
using OxyPlot.Legends;
using OxyPlot.Series;

namespace OxyPlotProject.OxyPlotPlotModel
{
    /// <summary>
    /// 左右にY軸PlotModelファクトリー
    /// </summary>
    internal class YAxisLeftRightPlotModelFactory : AbstPlotModelFactory
    {
        public override PlotModel Create()
        {
            // モデル
            PlotModel plotModel = new PlotModel();
            plotModel.Title = "サンプルグラフ";

            // ライン左軸
            LinearAxis linearLeftAxis = new LinearAxis();
            linearLeftAxis.Position = AxisPosition.Left;
            linearLeftAxis.Key = "leftAxis";
            plotModel.Axes.Add(linearLeftAxis);

            // ライン左
            LineSeries lineLeftSeries = new LineSeries();
            lineLeftSeries.Title = "サンプルライン左軸";
            lineLeftSeries.YAxisKey = "leftAxis";
            lineLeftSeries.Points.Add(new DataPoint(0, 34));
            lineLeftSeries.Points.Add(new DataPoint(10, 22));
            lineLeftSeries.Points.Add(new DataPoint(20, 45));
            lineLeftSeries.Points.Add(new DataPoint(30, 30));
            lineLeftSeries.Points.Add(new DataPoint(40, 43));
            lineLeftSeries.Points.Add(new DataPoint(50, 11));
            lineLeftSeries.Points.Add(new DataPoint(60, 21));
            lineLeftSeries.Points.Add(new DataPoint(70, 29));
            lineLeftSeries.Points.Add(new DataPoint(80, 17));
            lineLeftSeries.Points.Add(new DataPoint(90, 31));
            lineLeftSeries.Points.Add(new DataPoint(100, 23));
            plotModel.Series.Add(lineLeftSeries);

            // ライン右軸
            LinearAxis linearRightAxis = new LinearAxis();
            linearRightAxis.Position = AxisPosition.Right;
            linearRightAxis.Key = "rightAxis";
            plotModel.Axes.Add(linearRightAxis);

            // ライン右
            LineSeries lineRightSeries = new LineSeries();
            lineRightSeries.Title = "サンプルライン右軸";
            lineRightSeries.YAxisKey = "rightAxis";
            lineRightSeries.Points.Add(new DataPoint(0, 12));
            lineRightSeries.Points.Add(new DataPoint(10, 45));
            lineRightSeries.Points.Add(new DataPoint(20, 64));
            lineRightSeries.Points.Add(new DataPoint(30, 78));
            lineRightSeries.Points.Add(new DataPoint(40, 95));
            lineRightSeries.Points.Add(new DataPoint(50, 94));
            lineRightSeries.Points.Add(new DataPoint(60, 63));
            lineRightSeries.Points.Add(new DataPoint(70, 54));
            lineRightSeries.Points.Add(new DataPoint(80, 74));
            lineRightSeries.Points.Add(new DataPoint(90, 64));
            lineRightSeries.Points.Add(new DataPoint(100, 32));
            plotModel.Series.Add(lineRightSeries);

            // 凡例
            Legend legend = new Legend();
            legend.LegendSymbolLength = 30;
            plotModel.Legends.Add(legend);

            return plotModel;
        }
    }
}
ライン左軸 linearLeftAxisに”leftAxis”、ライン右軸 linearRightAxisに”rightAxis”をキーとして設定します。
ライン左、ライン右にそれぞれの軸のキーを設定しています。
プロジェクトを実行したところ、↓のように表示できました。左右それぞれに軸が表示され、ラインもそれぞれの軸に対応しています。
今回のプロジェクトは↓から取得できます。
GitHub

GitHub - HomeProgrammer81/OxyPlotProject at main_yAxisLeftRight
Contribute to HomeProgrammer81/OxyPlotProject development by creating an account on GitHub.
まとめ
C# WPFアプリケーション OxyPlotにおいて、Y軸を左右に設定する方法を書きました。


コメント