本記事では、バー(Bar)をX軸に表示する方法を書きます。
Y軸に表示する方法はネットでたくさん見つけたのですが、X軸に表示する方法は見つけられませんでした。なので記事として、書きたいます。
開発環境
- Windows10
- Microsoft Visual Studio Community2022
- .NET 6
- WPF アプリ
- OxyPlot 2.1.2
目次
やりたいこと
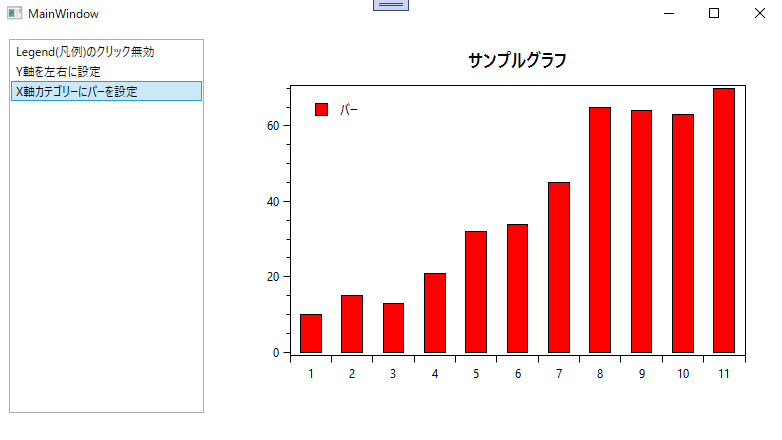
OxyPlotでバーをX軸に表示します。
コード
ポイントは、
- バーのX軸キー( barSeries.XAxisKey ) に、X軸のキー( xAxis.Key ) を設定します。
- バーのY軸キー( barSeries.YAxisKey ) に、Y軸のキー( yAxis.Key ) を設定します。
です。
バーに設定するキーをX軸、Y軸を逆にします。
using OxyPlot;
using OxyPlot.Axes;
using OxyPlot.Legends;
using OxyPlot.Series;

namespace OxyPlotProject.OxyPlotPlotModel
{
    /// <summary>
    /// X軸バープロットモデルファクトリー
    /// </summary>
    internal class XAxisBarPlotModelFactory : AbstPlotModelFactory
    {
        public override PlotModel Create()
        {
            // モデル
            PlotModel plotModel = new PlotModel();
            plotModel.Title = "サンプルグラフ";

            // カテゴリーX軸
            CategoryAxis xAxis = new CategoryAxis();
            xAxis.Position = AxisPosition.Bottom;
            xAxis.Key = "xAxis";
            plotModel.Axes.Add(xAxis);

            // ラインY軸
            LinearAxis yAxis = new LinearAxis();
            yAxis.Position = AxisPosition.Left;
            yAxis.Key = "yAxis";
            plotModel.Axes.Add(yAxis);

            // バー
            BarSeries barSeries = new BarSeries();
            barSeries.Title = "バー";
            barSeries.XAxisKey = "yAxis";
            barSeries.YAxisKey = "xAxis";
            barSeries.FillColor = OxyColors.Red;
            barSeries.StrokeThickness = 1;
            barSeries.StrokeColor = OxyColors.Black;
            barSeries.BarWidth = 50;

            barSeries.Items.Add(new BarItem() { Value = 10 });
            barSeries.Items.Add(new BarItem() { Value = 15 });
            barSeries.Items.Add(new BarItem() { Value = 13 });
            barSeries.Items.Add(new BarItem() { Value = 21 });
            barSeries.Items.Add(new BarItem() { Value = 32 });
            barSeries.Items.Add(new BarItem() { Value = 34 });
            barSeries.Items.Add(new BarItem() { Value = 45 });
            barSeries.Items.Add(new BarItem() { Value = 65 });
            barSeries.Items.Add(new BarItem() { Value = 64 });
            barSeries.Items.Add(new BarItem() { Value = 63 });
            barSeries.Items.Add(new BarItem() { Value = 70 });
            plotModel.Series.Add(barSeries);

            // 凡例
            Legend legend = new Legend();
            legend.LegendSymbolLength = 30;
            legend.LegendPosition = LegendPosition.TopLeft;
            plotModel.Legends.Add(legend);

            return plotModel;

        }
    }
}
barSeries.XAxisKeyにY軸のキー”yAxis”、barSeries.YAxisKeyにX軸のキー”xAxis” を設定します。
プロジェクトを実行したところ、↓のようにバーをX軸に表示できました。
作成したプロジェクトは↓からダウンロードできます。
GitHub

GitHub - HomeProgrammer81/OxyPlotProject at main_xAxisBar
Contribute to HomeProgrammer81/OxyPlotProject development by creating an account on GitHub.
まとめ
バー(Bar)をX軸に表示する方法を書きました。


コメント